Your Market-Rate Returns Come From Someone

In 2023, $3.9 trillion that would have gone to the bottom 90 percent of Americans in income went to grow the wealth of the top 10% instead. That was a single year. The cumulative shortfall since 1975, by RAND's calculation, has reached $79 trillion.
That is one of the ways that wealth gets hoarded and extracted, in one country. The U.S. economy grew about 2.2% last year. Real GDP growth in advanced economies has averaged between 1% and 3% for decades. That is the productive output of the actual world: the goods produced, the services delivered, the capability built.
Now look at your portfolio. Most private and endowed capital in this country targets a nominal return of 7% to 10%. Some target more. Foundations do it. Donor-advised funds do it. Endowments do it. Family offices do it. Wealth managers tell their clients that anything less is failure.
Subtract the first number from the second. Where does the difference come from?
It does not come from nowhere. It comes from someone. Some firms genuinely outgrow the real economy, and some sectors will always run faster than others. But when an entire pool of capital, endowments and foundations and family offices and wealth managers, targets returns above productive growth, the question stops being about one outlier and starts being about what the average requires. The $3.9 trillion is what “someone” looks like in a single year, from a single mechanism, in a single country.
Picture one company. It makes the same product, sells the same amount, employs the same people. Nothing about what it produces has changed. But its owners need it to return 8% this year. Where does the 8% come from? It thins the payroll. It raises the price. It defers the maintenance and books the gain. The company did not get more productive. Someone inside the picture got less. Now run the same company again, with owners who ask only for what it actually produces. Same product, same people, same year. Nobody is squeezed, and the owners still earn. The only thing that changed is the number the owners wrote down. Multiply the first company by an economy and you have the figure at the top of this post.
I am not writing this from the outside. For years I helped build Facebook, now Meta. The company told the market it was there to make the world more open and connected, and later to give people the power to build community and bring the world closer together. Inside, the force that actually moved us was the share price. Every quarter we pushed to deliver the revenue the market expected, not necessarily the thing that was right. We invested more and more in advertising and less and less in keeping people safe, until we had built arguably the best provable advertising business in history and left the people who used the product to fend for themselves. The market's expectations paid for the next thousand engineers, and the engineers bought the next increment of reach and power. The difference between what we produced and what we took did not disappear. It came from the users.
The math is the whole argument
Try this on the next investor letter you read.
Real value created − Your return = What is left for everyone else.
If your return exceeds the share of value the underlying activity actually produced, the difference has to be taken from somewhere. That somewhere is one of four parties: the workers at the company, the customers and communities the company serves, the natural systems the company depends on, or the taxpayers who subsidized the company in the first place.
Now come at it from the other direction. RAND measured this gap from the income side: what stopped reaching the bottom 90 percent once incomes no longer kept pace with GDP. Measure it from the return side and you land in the same place. Tens of trillions of dollars of U.S. institutional and private capital, the foundations and endowments and family offices named above and the far larger pools beside them, are managed to return targets set above the growth of the real economy. A pool that size clearing even a few points above real growth produces a gap on the order of a few trillion dollars a year. Every year. Two independent calculations, one starting from paychecks and one from portfolios, land in the same range. That is not a coincidence. It is the same transfer, measured from opposite ends. The wealth pump runs on that arithmetic.
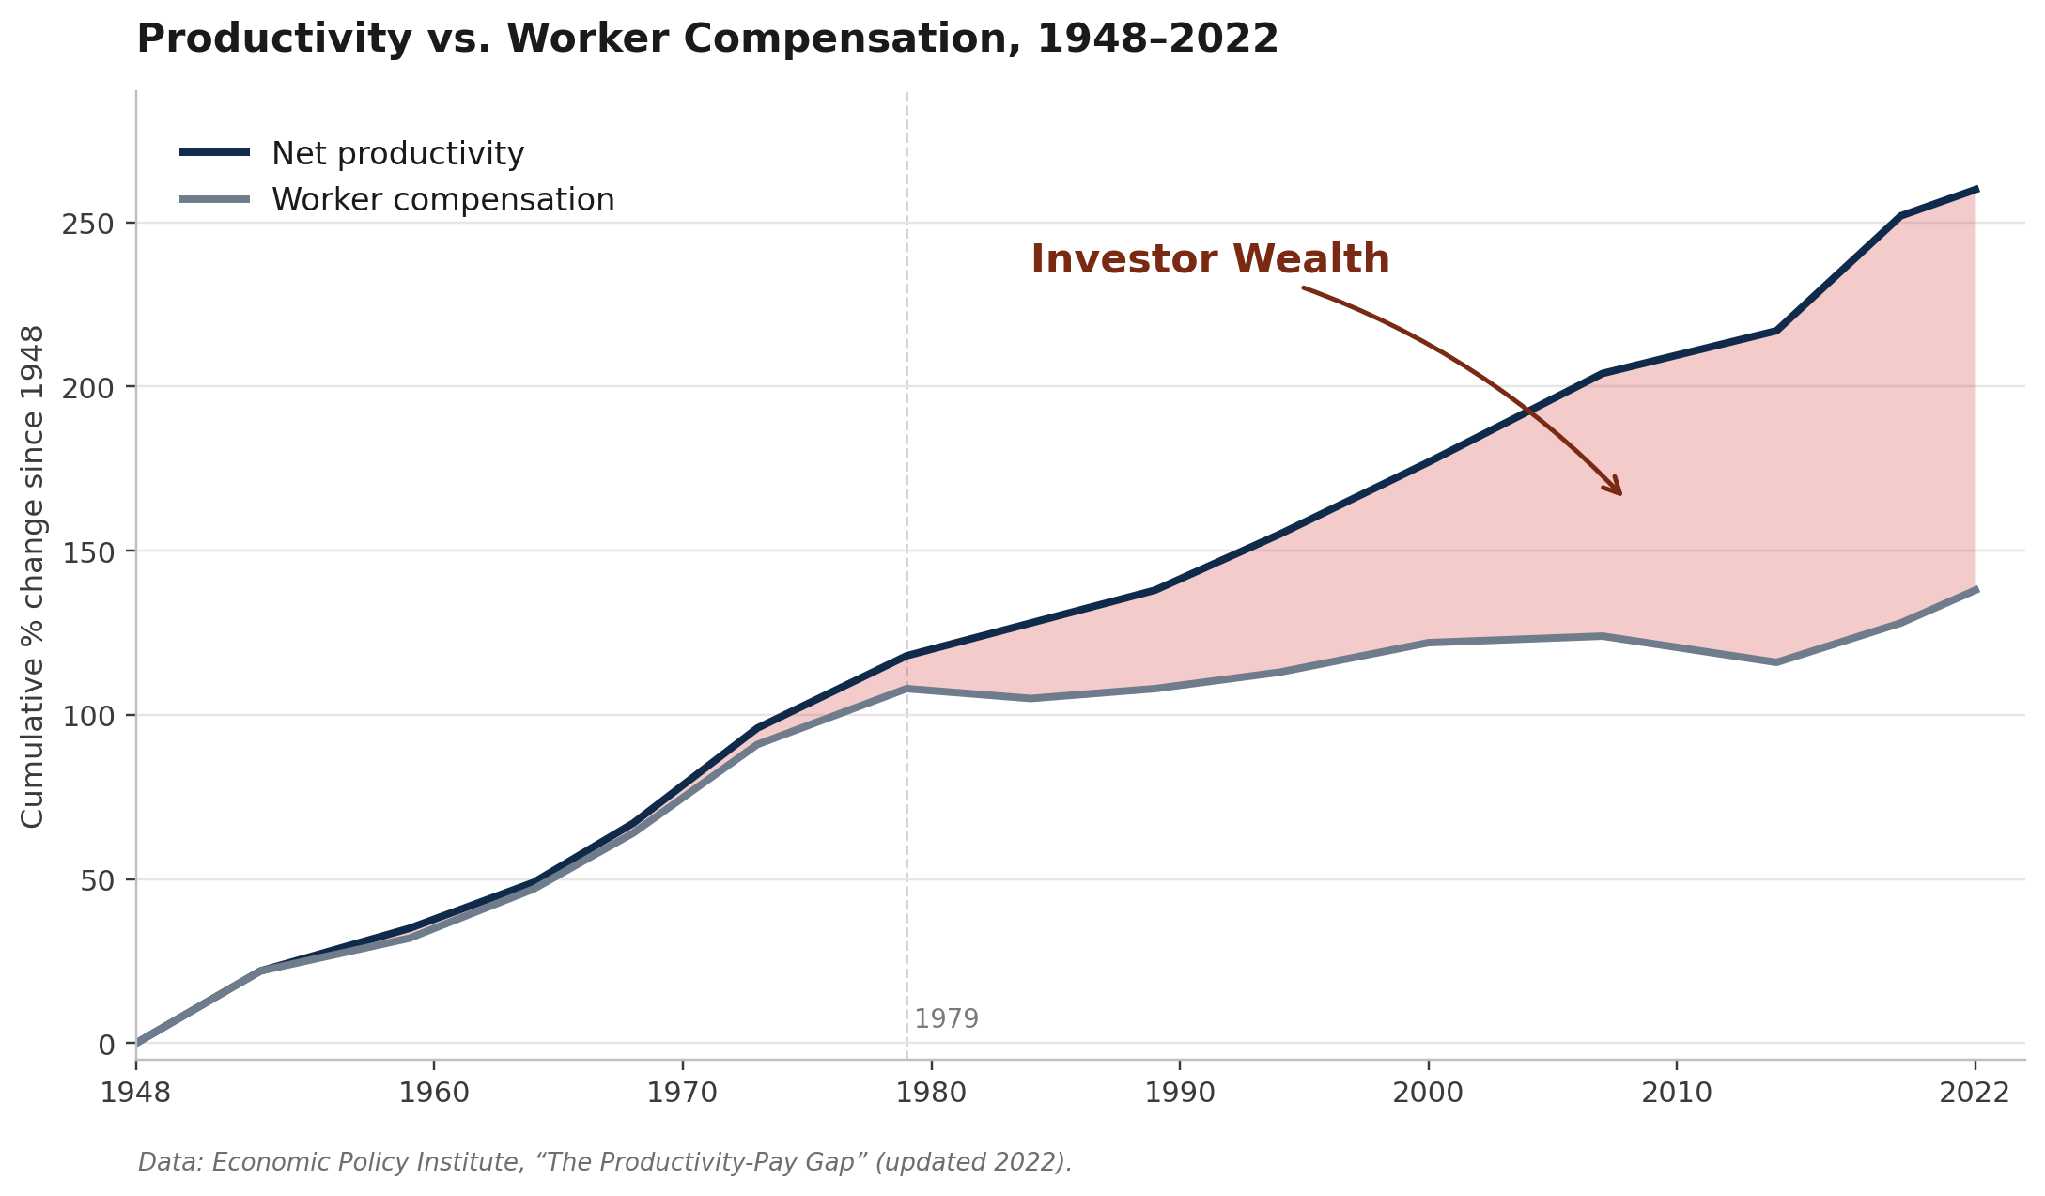
Productivity vs. worker compensation, 1948–2022 (data: EPI). Pay tracked productivity until the mid-1970s, then split from it: since 1979 productivity has grown about three and a half times as fast as pay for the typical worker. That widening gap is the same divergence RAND measured in dollars, the share of growth that stopped reaching the people who produced it.
The Mechanism of Extraction
A variety of different channels carry the transfer. Your portfolio almost certainly touches all of them.
Wage compression. We named the $3.9 trillion at the top. The labor-share decline is what produces it: by BLS's measure, workers' share of nonfarm business output stayed near 65% through the 1970s and sits at 54.4% by the most recent reading. EPI estimates U.S. workers lose as much as $50 billion a year to wage theft on top of the systemic transfer, more than all robbery, burglary, and motor vehicle theft in the country combined. The chart above is what 75 years of this looks like.
Rent capture. Asset managers buy water utilities, toll roads, telecom towers, and single-family homes, hold them a few years, and exit at returns the underlying service could never have produced on its own. The gap is closed through rent increases, deferred maintenance, and regulatory advantage. Two private-equity-shaped firms, DaVita and Fresenius, control roughly 70% of U.S. dialysis: patients cannot leave, outcomes have worsened, and Medicare pays the bill. Private water utilities charge about 59% more than public ones for the same water (Food & Water Watch). In the Sun Belt markets where Wall Street concentrated its home buying after 2008, two-bedroom rents rose 35% to 44% between January 2020 and January 2023, against 24% nationally.
Externalization. The Sackler family alone pulled more than $10 billion out of Purdue Pharma between 2008 and 2018 while the opioid epidemic ravaged communities. Meta is now in active litigation by 41 state attorneys general for harms to adolescent users that were never priced into its earnings. A 2021 NBER paper by Gupta, Howell, Yannelis, and Gupta found that private-equity ownership of U.S. nursing homes raised resident mortality by 10%, an estimated 21,000 lives lost over the sample period. Profits booked. Costs paid by everyone else.
Public subsidy. Mariana Mazzucato has documented that nearly every part of the modern smartphone runs on technologies financed by public research: the touchscreen, GPS, the internet protocol suite, voice recognition. The returns accrue to private capital. The carried-interest loophole alone hands private equity and hedge fund managers billions of dollars a year that wage earners would pay tax on. The state closes the gap so private capital can clear its target.
None of this is hidden. It is just not on your quarterly statement.
The benchmark is the mechanism
When Morgan Stanley reports your portfolio against the S&P 500. When Cambridge Associates builds your foundation's Investment Policy Statement against a 70/30 benchmark. When BlackRock packages a target-date fund. When KKR pitches you a 20% IRR. None of those firms is showing you the source of the return. They are showing you the size of it.
Treating market rate as a neutral measuring stick is the move that institutionalizes extraction. A single endowment targeting 8% might earn it cleanly, from a genuine claim on real growth. But it cannot prove it did, and it is not the only one writing the number. When every endowment, foundation, and family office sets the same target, the field has issued a standing order to the real economy: produce several points of extraction on top of whatever the underlying activity grows. The order has a number on it. The number has a cost. The signer rarely has to ask which one.
The objection writes itself: returns can come from real value, from risk borne, from a company that genuinely built something new. True, and that is the exception worth protecting. An investor can own real productivity growth, and bearing risk is a real service. But the equity premium explains why capital earns more than the risk-free rate. It does not explain how an entire asset class clears several points above the whole economy's growth, year after year. One investor can be the genuine outlier. All of them cannot. The system sells everyone the outlier's story.
We are not saying market-rate returns are impossible. We are saying that across the pool, when they exceed what the real economy actually produced, somebody paid for the difference. Anyone who keeps that math invisible, whatever their intent, is a participant in the order.
There is no smarter seat
A familiar story says the smart investor outruns this. You pick the right manager. Your returns beat the benchmark. Your portfolio outperforms.
The story collapses on its own arithmetic. The benchmark itself sits above what the real economy produces. Beating it means taking a bigger share of the same gap. Outperformance is winning a larger slice of what was already extracted.
A single fund manager may genuinely beat their peers. But when the whole asset class is targeting returns above what the real economy actually produces, beating the average inside that class is rearranging who gets the bigger share of the gap. Someone always wins the tournament. The tournament is the problem.
The same trap, two ways
If you sit on a foundation board, the contradiction is sharpest. Under the 5% payout floor, the foundation invests roughly twenty dollars for every one dollar it grants. If those investments are earning their returns through any of the four mechanisms above, the foundation is funding the harm at twenty times the rate it is funding the repair. The mission statement and the Investment Policy Statement are pointing in opposite directions.
If you steward family wealth, there is no mission statement to create the visible contradiction, but the structural fact is identical. UBS reports that U.S. family offices now allocate 54% of their portfolios to alternatives, 27% to private equity alone. That is concentration into the asset classes whose return profiles most depend on the four mechanisms. The capital is doing the same thing. You just have nothing on paper against which to notice.
What fair returns would look like
Set the return target for any pool of capital at or below the productive growth rate of the activities the capital is invested in. Call it the non-extractive ceiling. Call it fair returns. Call it sufficient returns. The point is that the number on the IPS is no longer a mandate to extract.
Then ask three questions of whoever manages your money. Of the return I earned this quarter, how much came from real productive growth, and how much came from financial leverage, multiple expansion, cost cuts, rent extraction, or subsidy capture? Which of my holdings could not produce these returns from the underlying activity alone? What would my portfolio look like if the return target were set at the productive growth rate of the real economy?
Most reporting today cannot answer any of these. That gap is by design. The first thing that changes when capital holders start asking different questions is what gets measured. The second thing that changes is what gets built.
An invitation, on both sides of the table
We are still learning what this looks like at scale. We have made our own portfolio mistakes. We have taken impact pitches at face value and watched them sour. The framework here is a working position, not a finished product.
If you are an advisor and you disagree with this, we want the case. If you are an advisor and you have been waiting for permission to recommend something different, take this as the permission. If you are an investor and you want help building a portfolio that targets fair returns instead of maximum returns, we are working on a new tool that we can’t wait to share. Let us know that you are interested and we will be sure to let you know when it is ready
The math does not care which side of the table you sit on. Returns above what the world actually produced come from somewhere. The work is to stop pretending otherwise.
Member discussion